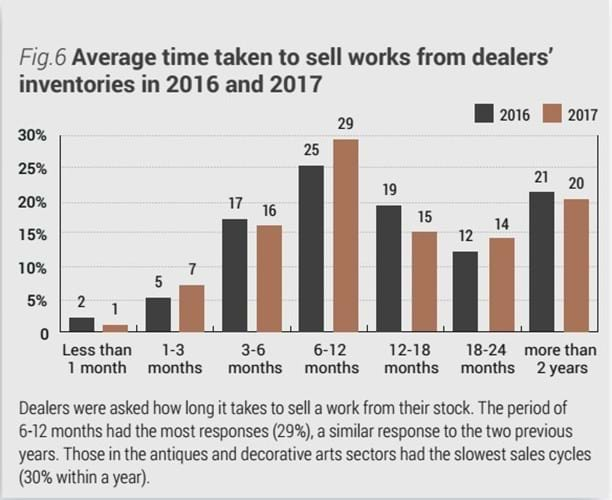
Your first impression of this data is, “blimey! It takes dealers a long time to sell anything”. It suggests that members of the trade need the patience of saints. But in fact, the reality is more nuanced than that.
Our sales year has always been driven by key weeks in the calendar.
As a dealer specialising in fashion illustration, design and modern textiles, we have sold primarily from fairs and one-off exhibitions, such as our Drawing on Style shows in temporary spaces during the London and New York fashion weeks.
Our sales always spike during these events. Though the report indicates it can take a year to sell stock, we often hold on to offerings we think suit upcoming events best. Having a great, coherent selection at a fair or show makes all the difference.
Because we don’t have a permanent space, people visit us at these temporary shows and fairs. Those dealers with shops are likely to have a different experience, and the proliferation of online platforms may impact these statistics in the future.
Also, when something fails to sell at a fair, we don’t just recycle it at the next; it would be presented later in a different context.
All that said, it’s easy to get despondent during slow days at fairs. I’m going to keep the graph and look at it once a month for therapy – a reminder that the sales will come.
Ashley Gray Director, Gray MCA


